Abstract
There is a tendency for many people to look at the lush Forest Park and see the park as an example of a primeval forest, a true wilderness. However the City of Portland’s Forest Park has been imprinted by many generations of people using it for purposes ranging from survival subsistence/living quarters and industrial resource extraction to recreation and contemplation. The current trail system consisting of over 80 miles of pathways is well documented on maps and signage, but previous generations created and used pathways and roads that are not visible today nor found on many maps. In addition, present-day “use” trails exist as a result of people persistently following tracks off the official trail system. Consequently the human imprint on the park land is greater than most people realize.
New technologies enable detection of old or unofficial pathways, but no context as to why the imprint was created. By analyzing historical records, I will attempt to classify the entire set of imprinted pathways by time period and reason for creating the path.
Introduction:
The project used high resolution LIDAR data to identify pathways that have left an imprint on the land in the study area. Today’s official trail system was segregated out and its mileage computed. The remaining “invisible network” of pathways was totaled for a summary comparison. An on site inspection determined whether imprints identified using LIDAR actually represent current or former pathways. Pathways were compared with historic maps to classify them into historic periods. The contrasting meshes of historic pathways vs. today’s official and unofficial trails is displayed in a poster-sized map view of the park, and a time animation of the study area displaying paths color-coded according to documented or inferred reasons for their original development. These results allow viewers to grasp the density of Forest Park human pathways through time.
Study area and data layers:
The study area is in the southern Tualatin Mountains in Multnomah County, Oregon. In particular, the public lands contained in the area east of Skyline Drive, west of the Willamette River, north of Hwy 26 and south of Newberry Road.
The data layers that were used include:
• Existing pathways, hydrology, roads, and boundaries as shapefiles
• Topography (3 foot LIDAR)
• Historic maps of the area
• Data as to whether pathways are currently used or not
The sources for this information include the City of Portland, the Metro RLIS dataset, the Oregon GeoSpatial Clearinghouse, the City of Portland, libraries, and on-site data collection.
Methods, techniques and assumptions:
• Extract LIDAR data for study area, reproject it and create range of shaded relief outputs for different sun angles
• Perform differential shading analysis
• Perform exaggerated relief analysis
• Evaluate possible pathways; trace
• Validate a statistically significant subset of detected paths with on-the-ground observation
• Summarize magnitude of invisible pathways, and classify by historical timeframe and purpose
Conventional 10m DEM topography data is not suitable for this approach, as can be seen in the following extract of a ~half-mile square area of Forest Park containing the Leif Erikson, Wildwood, Maple and Saltzman Road trails.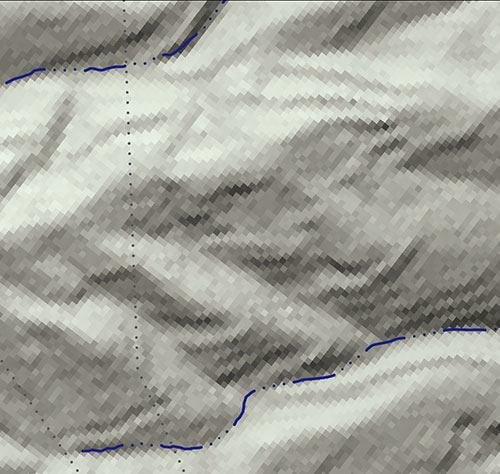 Forest Park conventional 10m shaded relief
The differential shading analysis was performed in Photoshop using shaded relief with opposing sun angles. Shaded relief images were overlaid in Photoshop and every layer compositing mode tested for the best extraction of linear surface features. Three layer modes that seemed most effective were difference, exclusion, and lighten color (see following illustrations).
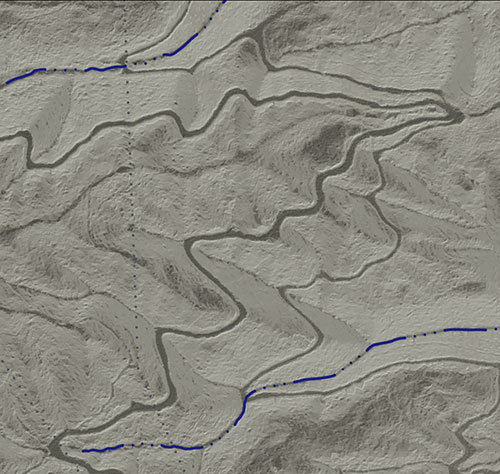 Forest Park LiDAR shaded relief in Photoshop difference mode
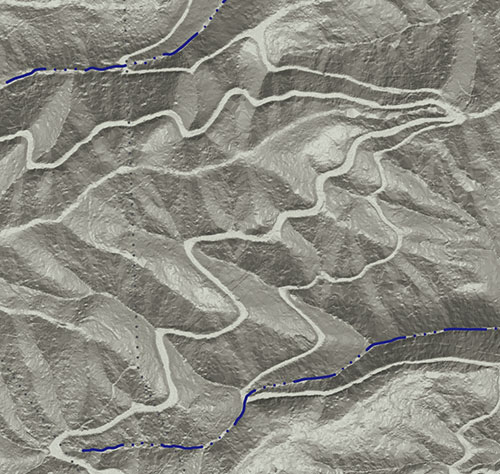 Forest Park LiDAR shaded relief in Photoshop lighten color mode
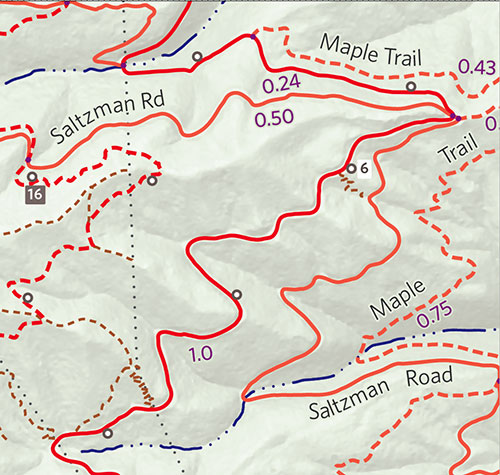 Forest Park trails as revealed by tracing the LiDAR (Leif Erikson is solid red, Wildwood is dashed red, and dashed brown are mainly accessways built by utility companies to install/maintain their electric lines, shown as dotted black lines.)
Software tools:
The primary software tools include ArcMap, GlobalMapper, Photoshop, Natural Scene Designer, Google Earth and Adobe Illustrator. Secondary tools include iMovie, Photo To Movie, and NG Topo!
Assumptions:
Pathways in the study area are the result of human activity.
There are not any significant faultlines with surface trenches in the study area.
Limitations and pitfalls:
Old pathways which have been bulldozed over by newer roads are largely not detectable with LIDAR but would be an valuable addition to the pathway topology. Historical sources suggest that pioneer roads through the West Hills often followed Native American trails.
Echos of power lines can appear as imprints on the ground.
At least one "pathway" was actually a flume.
Removal of earth for mining and wetlands fill are not included in this analysis. An all inclusive look at the human imprint would examine these factors too.
Results and discussion
The results include:
• Time–series animations (off-line)
• Network contrast animation (off-line)
• Summary mileages for path networks
• Poster maps (a subset is on-line at Forest Park maps)
Mileage Summary
These values were computed from flattened representations of the trails, so they provide a generalized frame for comparison. Much of the official trail network conforms to topo lines, so it is likely to be closer to the actual number, with the unofficial mileage under-reported.
Official trail network: 89.0 miles
Unofficial/Use/Inactive paths: 82.8 miles
(These figures do not include the Audubon Sanctuary or the Metro lands to the north of Newberry Road but do include Washington Park.)
(Part of this project involved a interpretive look at the history of the trails and attempted to identify mileages by time period. That has been omitted from this online version).
One facet of using LIDAR data for this purpose is that it does not reveal features along the vertices of geological formations, nor in very flat areas. Based on personal experience, there should be “use” trails running along some of the streams and ridges of Forest Park which were not detectable in this LIDAR dataset. I believe when those undetected use pathways are added in, there is a high likelihood that the invisible pathway mesh would be comparable or greater than the official trail mileage.
Conclusions
Much more field checking needed to validate and correct for blind spots in LIDAR data, especially along geological vertices. The number of use trails “discovered” via LIDAR ballooned so quickly that the original intention of verifying them all became impossible in the time frame available.
I believe Forest Park has much more dense trail footprint than most people realize. Even if you are looking in person, it is unlikely you would see all the human imprints that are there but covered by vegetation or deliberate masking where the City does not want old trails to be used anymore.
A large segment of the human footprint in the park was developed after the park was established in 1947. The two primary reasons for this include the fires of 1951 which resulted in the City creating the fire lane system to allow fire engines to reach interior areas. Secondly the City permitted electric utilities and other utilities to build road infrastructure to install and service power lines and pipelines.
Lastly, LIDAR is incredibly useful for map-making in forested, non-flat areas.
Learnings
In comparing the LIDAR data with existing maps of the park, it appears the maps all have some serious misalignments in difference places. GIS data such as the linear feature for Leif Erikson Drive are better aligned with the LIDAR data.
--erik goetze
This is version 5; Jan 25, 2008
One City’s Wilderness: Portland’s Forest Park by Marcy Cottrell Houle
“The definitive guide” to Forest Park, with trail map, detailed lists of flora and fauna, trail descriptions, history and geology.The Shaping of a City by E. Kimbark MacColl. 1976
History of Portland’s Forest-Park, by Thornton T. Munger and C. Paul Keyser -- This
1960 history, re-published and annotated in 1998, contains detailed history of pre-park
days, as well as updated park information, maps, anecdotes and cultural history.Forest Park Management Plan. Gronowski, Nancy, Jim Sjulin, Tim Brooks, and Fred Nilsen. 1995. Portland Parks and Recreation and Portland Bureau of Planning, City of Portland.